Real Server Monitoring
The Configure—>Real Server Monitor page allows you to add, view and edit custom monitoring. These are layer 7 server “Health-Checks” and once configured will appear in the drop-down list for Server Monitoring.
Details
Name:
Double click on the column to manually add in a name for your monitor.
Description:
Double click on the column to manually add in a description for your monitor.
Monitoring Method:
Double click on the column to choose from the dropdown list.
Page Location:
Double click on the column to manually add in a page location for an HTTP monitor. This can be a relative link such as /folder1/folder2/page1.html. You can also use an absolute link where the web site is bound to the hostname.
Required Content:
Double click on the column to manually add in the required content. This will change depending on the monitoring method.
NOTE: Please ensure the response back from the Application server is not a “Chunked” response
| Monitoring Method | Description | Example |
|---|---|---|
| HTTP 200 OK | In this mode, a TCP connection is made to the content server as above, but after connection is made, a brief HTTP request is made to the content server.
A HTTP response is waited for and it is checked for the “200 OK” response code. If the “200 OK” response code is received, the content server is deemed to be up and running. If, for any reason, the “200 OK” response code is not received, including timeouts, failure to connect, etc. then the content server is regarded as down. This monitoring method can only really be used with HTTP and Accelerate HTTP service types, although if a Layer 4 Service Type is in use for an HTTP server, it could still be used if SSL is not in use on the content server, or is handled appropriately by the “Content SSL” facility. |
Name:
200OK Description Check production web site Monitoring Method: HTTP 200 OK Page Location: /main/index.html OR http://www.edgenexus.io/main/index.html Required Content: N/A |
| HTTP Response | In this mode, a connection and HTTP request/response are made/checked for as above, but instead of the “200 OK” response code being checked for, a custom text is searched for in both the HTTP headers, and the body of the HTTP response.
The text can be a whole header, part of a header, a line from part of a page, or just one word. If the text is found, the content server is deemed to be up and running. This monitoring method can only really be used with HTTP and Accelerate HTTP service types, although if a Layer 4 Service Type is in use for an HTTP server, it could still be used if SSL is not in use on the content server, or is handled appropriately by the “Content SSL” facility. |
Name:
Server Up Description Check content of page for “Server Up” Monitoring Method: HTTP Response Page Location: /main/index.html OR http://www.edgenexus.io/main/index.html Required Content: Server Up |
| DICOM | In this mode we send a DICOM echo using the AET value in the Required content column. | Name:
DICOM Description L7 health check for DICOM service Monitoring Method: DICOM Page Location: N/A Required Content: AET Value |
| TCP Out of Band | Using this method you can specify a TCP port to monitor using the required content column. This useful when you want to monitor a port that is linked to another service. A good example for this is Exchange 2010 that requires two ports to work 135 – RPC 59534 – CAS On a widows server port 135 will always be up. If 59534 fails then we want both Virtual Services to fail at the same time so we would apply this Monitor to the 135 Virtual Service. |
Name:
Monitor port 59534 Description: Layer 4 TCP monitor for 59534. Used on Virtual Service port 135 Monitoring Method: TCP Out of Band Page Location: N/A Required Content: 59534 |
Example
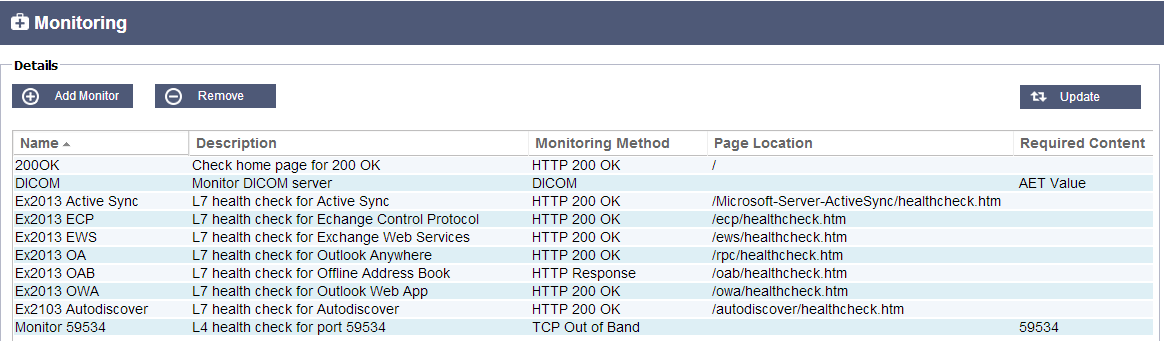
![]()