Widgets
The Library — Widgets
page allows you to configure various lightweight visual components that can be displayed in your custom dashboard.
Configured Widgets
In this section you will be able to view, edit or remove any widgets that you have created from the available widgets section

Available Widgets
Choose from 5 types of Widgets that you can customize:
Events:
- Click Add.

- Name your Event.
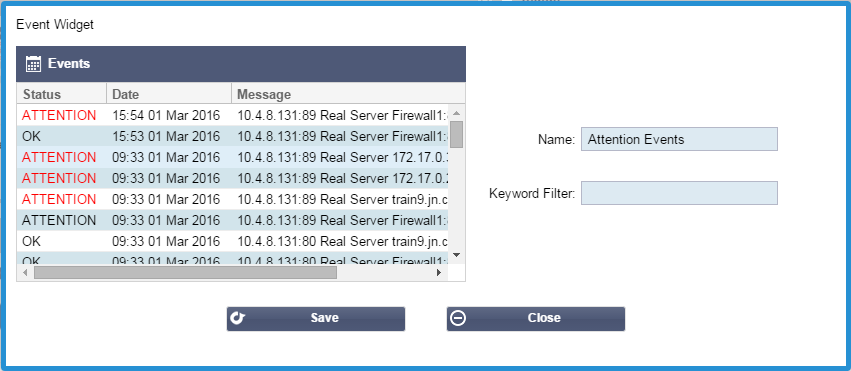
- Add a keyword filter then click Save then Close.
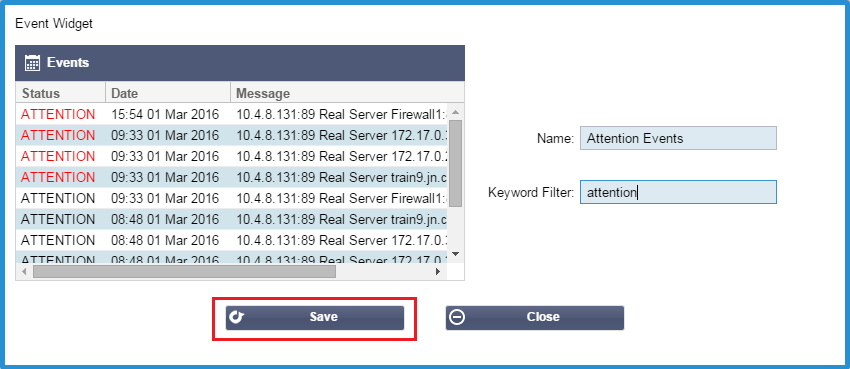
- You will now see an additional Widget called Attention Events in the Configured Widgets drop down.
- You can now add this Attention Events in the View — Dashboard.
- Select Attention Events to add this widget to the View — Dashboard page.
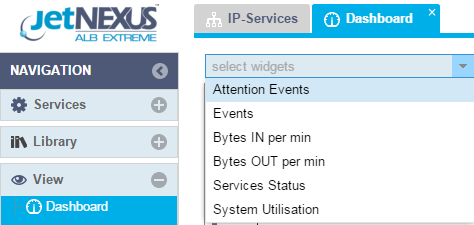
- You can move your widgets up and down and resize them
- If you have a lot of widgets with many live graphs then it is advisable to Pause Live Data and minimise the widgets before re-ordering.

- Once you have re-arranged your dashboard you can click Play Live Data to start receiving live information

System Graphs:
- Click Add
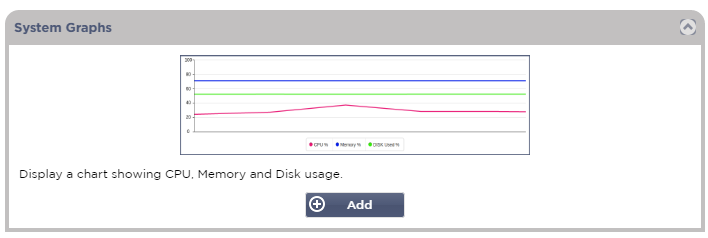
- Name your System Graph
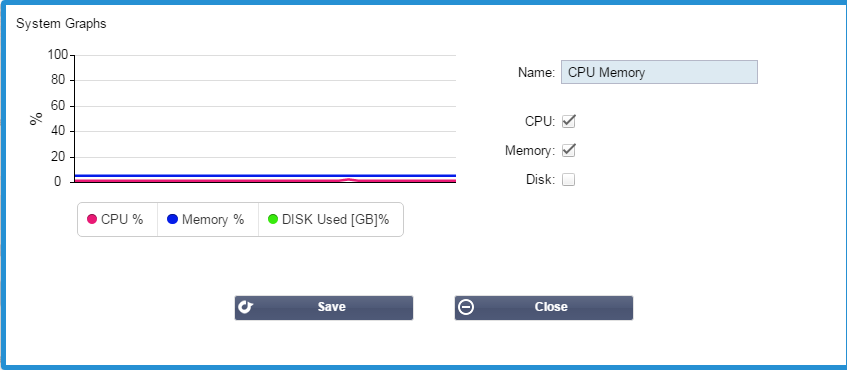
- You have three options for this graph. Tick the boxes that you wish to show in the graph
- Click Save then Close
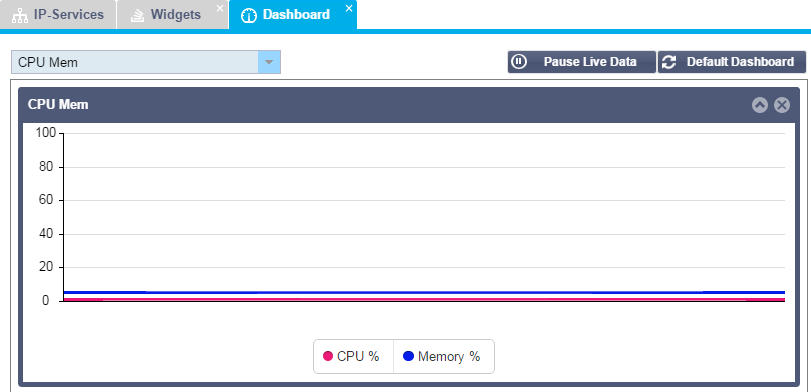
- You can now add your CPU Mem widget to the View — Dashboard page.
Interface:
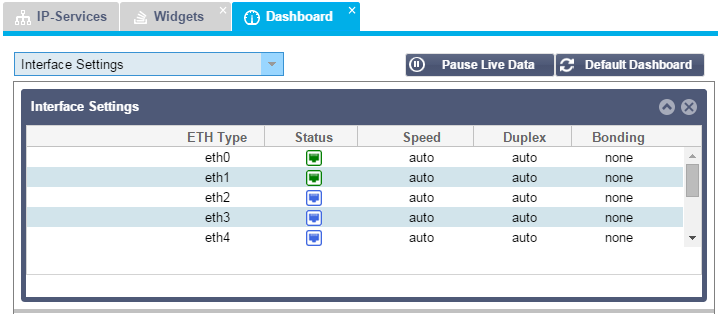
widget will show you the interface settings including status of each
interface. It will show you all interfaces available on your ALB-X.
- Click Add

- Name your Interface widget
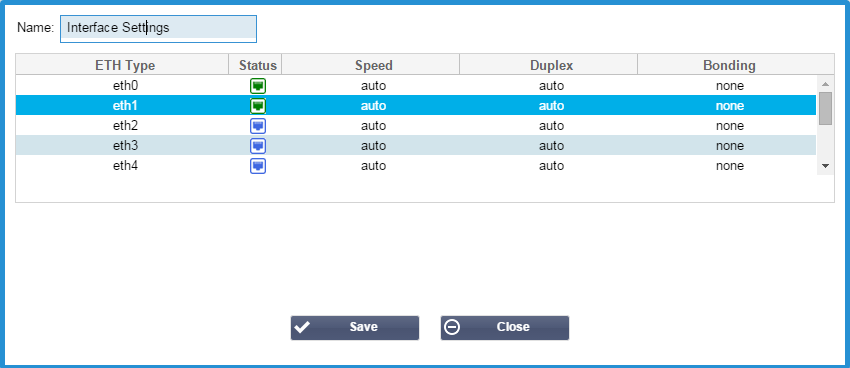
- Click Save and Close
- You can now add this widget to the View — Dashboard page.
Status:
- Click Add.

- Name your Status widget and add a filter if you wish to.
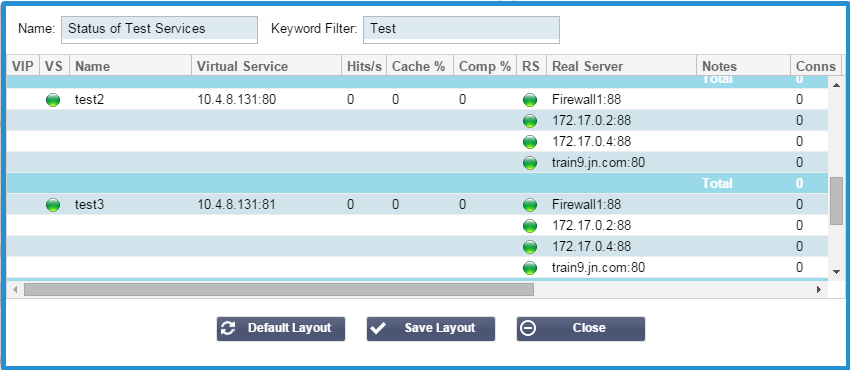
- You can also choose to tick which columns to show
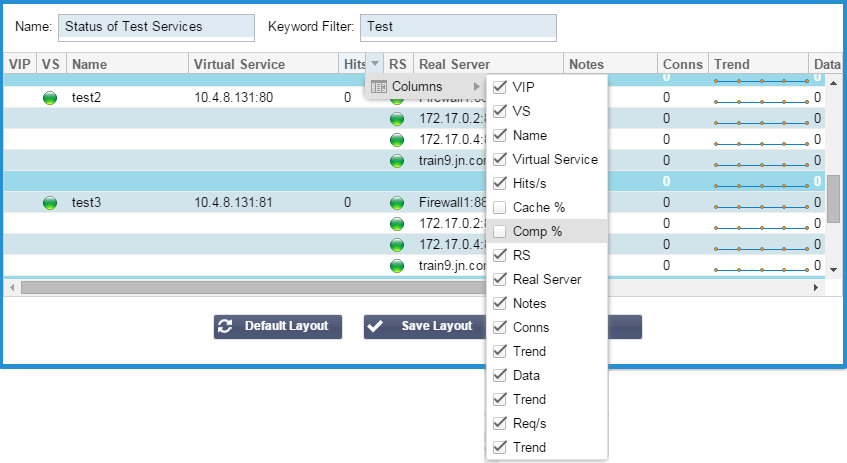
- Click Save Layout then Close.
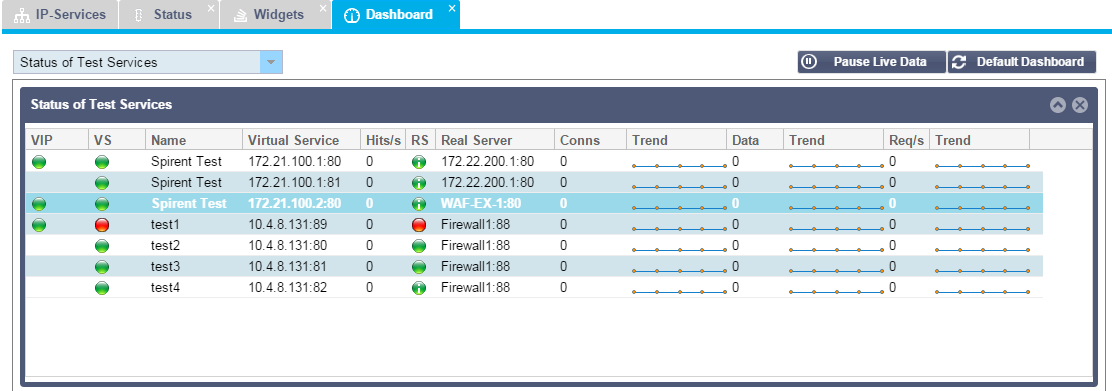
- You can now add your Status of Test Services widget to the View — Dashboard page.
Traffic Graphs:
This
widget can be configured to show current and historic traffic data per
Virtual Services and Real Servers. In addition you can see overall
current and historic data for global traffic
- Click Add

- Name your widget.
- Choose a Database from Virtual Services, Real Servers or System.
- If you choose Virtual Services then you can choose a virtual service from the VS/RS drop down.
- Choose a time frame from the Last drop down.
- Minute – last 60s
- Hour – aggregated data from each minute for the last 60 minutes
- Day – aggregated data from from each hour for the last 24 hours
- Week – aggregated data from each day for the last 7 days
- Month – aggregated data from each week for the last 7 days
- Year – aggregated data from the each month for the last 12 months
- Choose the Data available depending on the database you have chosen
- Virtual Services Database
- Bytes in
- Bytes out
- Bytes cached
- Compression %
- Current Connections
- Requests per second
- Cache Hits
- Cache Hits %
- Real Servers
- Bytes in
- Bytes out
- Current Connections
- Request per second
- Response time
- System
- CPU %
- Services CPU
- Memory %
- Disk Free %
- Bytes in
- Bytes out
- Virtual Services Database
- Chose to show either Average or Peak values
- Once you have chosen all the options click Save and Close
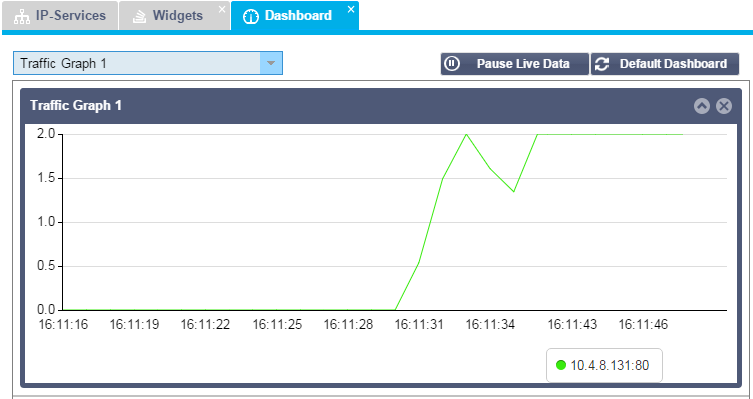
Example Traffic Graph:
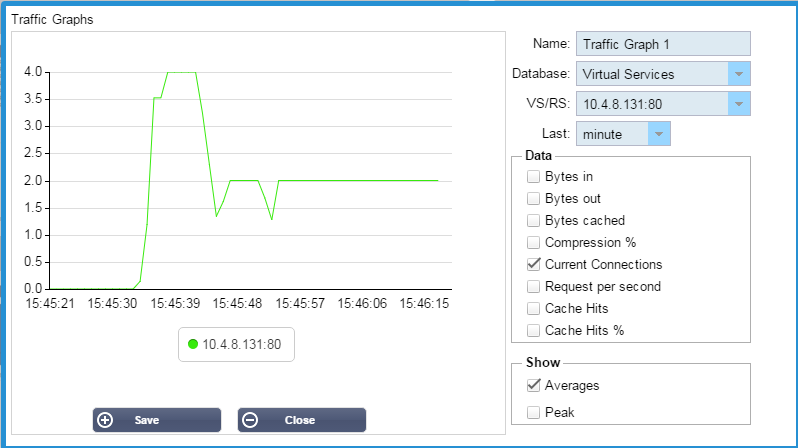
- You can now add your Traffic Graph 1 widget to the View — Dashboard page.
Top
 Back to