View History
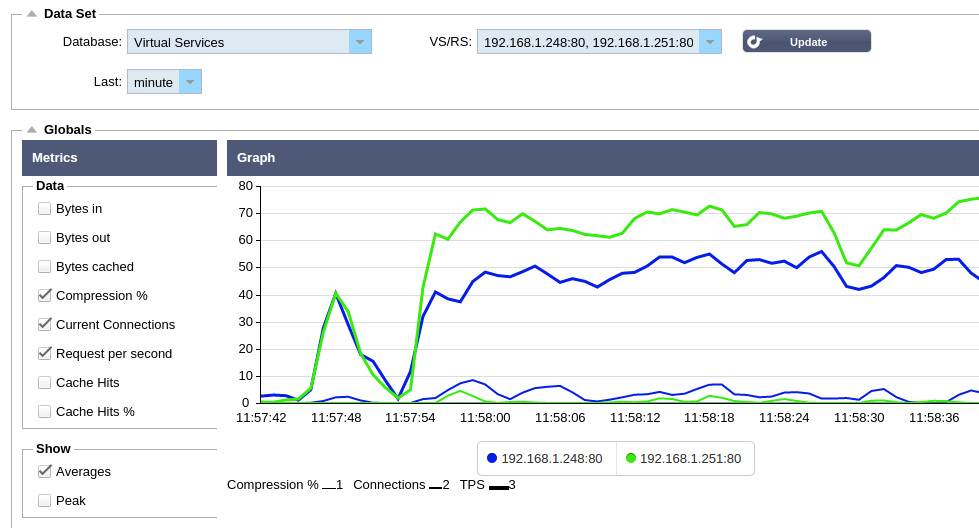
The View — History
page displays the historical traffic for your system, virtual
services and real services. It is a great way to see load balancing in
action and view any errors or patterns over time. Note that you must
enable historical logging from the System
— History page.
How do I see some graphs?
1. Choose a Database:
System:
will allow you to see CPU, memory and disk drive space over time
Virtual Services:
will allow you
to choose all of the virtual services in the database from the time
that you started logging data
Real Services:
will allow you
to choose all the real servers in the database from the time that you
started logging the data.
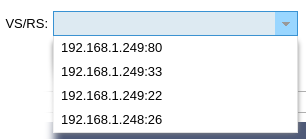
2. Choose VS/RS:
Virtual Service or Real Server: Note this will be blank if you choose
the system database as it is not relevant
Database chosen from above. You should now see a list of virtual
services. Click those that you wish to view, each one you click will be highlighted

If Real Servers Database chosen from above. You should now see a list of real servers. Click those that you wish to view, each one you click will be highlighted

3.
Last Minute:
data points, one for each second
Last Hour:
data points, one for each minute
Last Week:
data points, one for each hour
Last Month:
data points one for each day
Last Year:
data points, two for each month
4. Choose a metric
System:
maximum/average CPU % over the time period selected
Memory % – This will show the maximum/average Memory % over the time
period selected
Compression % – This will show the maximum/average Compression % over
the time period selected
the maximum/average traffic flow in from the server in Bytes over the
time period selected
Bytes out – This will show the maximum/average traffic flow out to the
client in Bytes over the time period selected
Bytes cached – This will show the maximum/average size of the
cached objects in Bytes over the time period selected
Compression %
Current Connections
Request per second
Cache HIts
Cache Hits%
Current Connections:
Pool Size
Request per second
5. Choose what to Show
Averages:
values over the period of time selected
Maximum:
data values over the period of time selected

Top
 Back to