Statistics
The Monitor-Statistics page allows you to view information about the traffic flowing through your jetNEXUS ALB-X. The page is split into four sections and organised below.
Compression
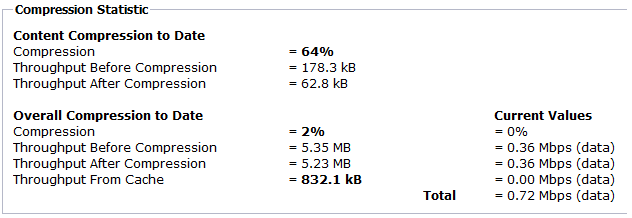
Content Compression to Date
This statistic reports how much compression the jetNEXUS ALB-X has achieved on compressible content. A typical percentage for this lies between 60-80%.
Overall Compression to Date
This statistic reports how much compression the jetNEXUS ALB-X has achieved on all content. A typical percentage for this depends how many pre-compressed images are contained on your services. The more images the smaller the overall compression percentage is likely to be.
![]()
Hits and Connections
This section contains the overall statistics for hits and transactions.
Hit:
A hit is defined as a layer 7 transaction. Typically for web servers this is a GET for an object such as an image.
Connection:
A connection is defined as a layer 4 TCP connection. Many transactions can occur over 1 TCP
connection.
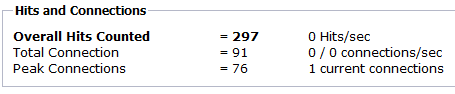
Overall Hits Counted
This is the cumulative number of non-cached hits since last reset. On the right hand side the figure will show the current number of hits per second.
Total Connections
This is the cumulative number of TCP connections since last reset. The first figure on the right hand side you can see the number of TCP connections per second to the ALB-X. The second number is the number of TCP connections per second to the content servers.
Example 6/8 connections/sec – This means we have 8 TCP connections per second to the jetNEXUS ALB-X Channels and 6 TCP connections per second to the content servers.
Peak Connections
This is the maximum number of TCP connections to the jetNEXUS ALB-X. The number on the right hand side gives the current number of active TCP connections.
![]()
Caching
This section will show the overall statistics in relation to caching when it has been applied to a channel. If caching has not been applied to a channel and configured correctly you will see 0 cache contents.
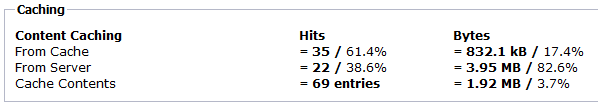
From Cache
Hits:
The first number gives the total number of transactions served from the jetNEXUS ALB-X cache since last reset. A percentage of total transactions is also provided.
Bytes:
The first number gives the total amount of data in KiloBytes served from the jetNEXUS ALB-X cache. A percentage of total data is also provided.
From Server
Hits:
The first number gives the total number of transactions served from the content servers since last reset. A percentage of total transactions is also provided.
Bytes:
The first number gives the total amount of data in KiloBytes served from the content servers. A percentage of total data is also provided.
Cache Contents
Hits:
This number gives the total number of objects contained in the jetNEXUS ALB-X cache.
Bytes:
The first number gives the overall size in MegaBytes of the jetNEXUS ALB-X cached objects. A percentage of the maximum cache size is also provided.
![]()
Hardware
This section provides the overall usage stats for the jetNEXUS ALB-X.
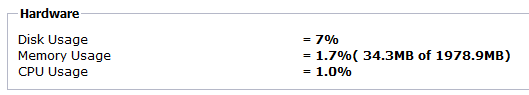
Disk Usage
This number gives the percentage of disk space currently used by jetNEXUS ALB-X and includes such things as the log files and the cache which is periodically stored on the hard drive.
Memory Usage
This number gives the percentage of memory currently used by jetNEXUS ALB-X. The larger number in brackets is the total amount of memory allocated to the JETNEXUS ALB-X. It is recommended that this is a minimum of 2GB.
CPU Usage
This number gives the percentage of CPU currently used by jetNEXUS ALB-X. It is natural for this to fluctuate.
![]()