Troubleshooting
The Advanced — Troubleshooting
page contains various sections that will allow you to investigate any issue you are having with your services.
The page is organised into the 4 sections below:
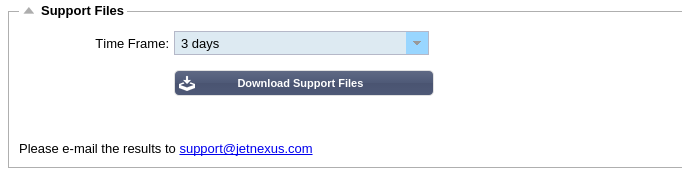
Support Files
If you have an issue with your ALB-X
and you need to open a support ticket they will often request a
number of different files from your ALB-X appliance. These files have now
been aggregated into one .dat file that can be downloaded via this
section.
- Select a time frame from the drop down
- 3 days
- 7 days
- 14 days
- All
- Click “Download Support Files”
- A file will be downloaded in the format Support-jetNEXUS-yyymmddhh-NAME.dat
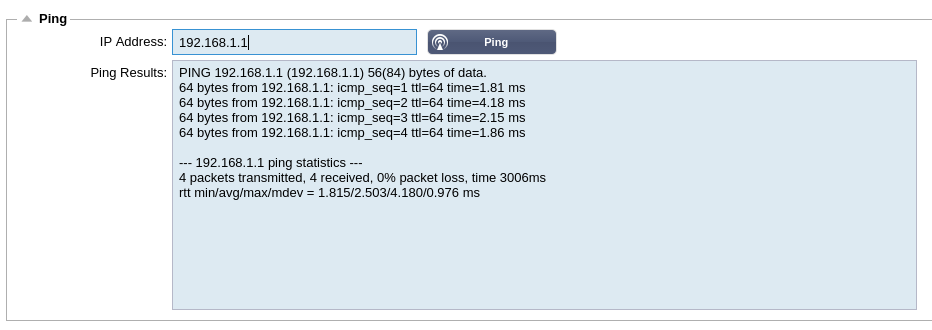
Ping
the default gateway using dotted decimal notation or an IPv6 address. You may have to wait
a few seconds for the result but to feedback that you have pressed the
“Ping” button it will go grey after pressing.
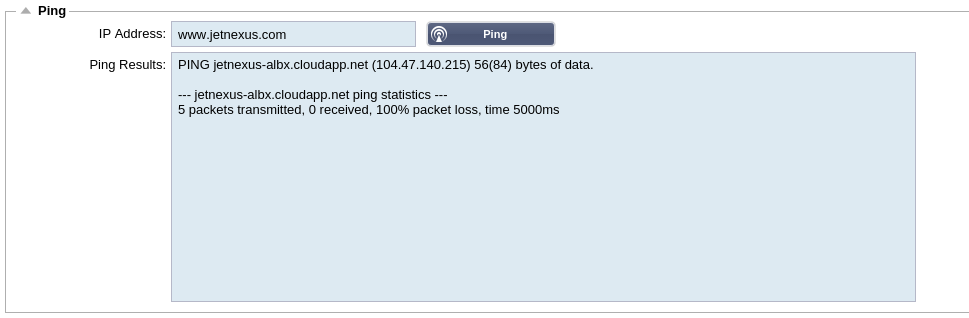
fully qualified domain name. You can configure a DNS server on the Appliance page. You may have to wait a few seconds for the result but to feedback that
you have pressed the “Ping” button it will go grey after pressing.
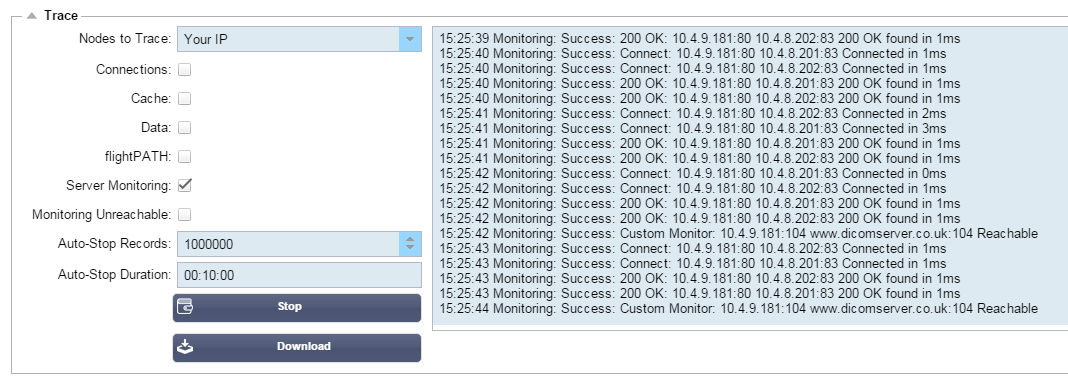
Trace
The
Trace section will allow you to see debug information depending on the
options you choose from the drop downs and the tick boxes.
- Nodes to Trace:
- Your IP:
This will filter the output to use the IP address you are accessing the
GUI from (Note do not choose this option for Monitoring as Monitoring
will use the ALB-X interface address) - All IP: No filter will be applied. It should be noted that on a busy box this will adversely affect performance.
- Your IP:
- Connections:
- This will show you information about the client and server side connections.
- Cache:
- This will show you information with regards to cached objects.
- Data:
- Shows the raw data bytes handled in and out by ALB-X.
- flightPATH:
- This will show you detailed information about the flightPATH rules active on your box including if your rules is matching the condition and evaluation.
- Server Monitoring:
- This will show the server health monitors active on your ALB-X and their respective result.
- Monitoring Unreachable:
- This is similar to above except it will only show the failed monitors and so acts like a filter for these messages only.
- This is similar to above except it will only show the failed monitors and so acts like a filter for these messages only.
- Auto-Stop Records:
- The default value is 1,000,000
records after which the Trace facility will automatically stop. This is
a safety precaution to prevent Trace accidentally being left on and
affecting the performance of your ALB-X.
- The default value is 1,000,000
- Auto-Stop Duration:
- The default time is set to 10 minutes after which the Trace facility will automatically stop. This is a safety precaution to prevent Trace accidentally being left on and affecting the performance of your ALB-X.
- Start:
- Click to manually Start the Trace facility.
- Stop:
- Click to manually stop the Trace facility before the automatic record or time is reached.
- Download:
- Although
you can see the live viewer on the right hand side the information may
be displayed too quickly. You can download the Trace.log to view all the
information gathered during the various traces that day. This
is basically a filtered list of trace information. If you wish to view
previous days trace information then you can download syslog for that
day but will have to filter manually.
- Although
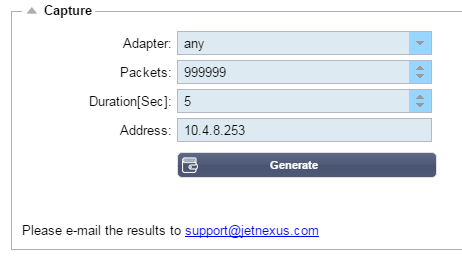
Capture
- Complete each box
- Click Generate
- Once
the capture has run your browser will pop-up and ask you where
to
save the file. It will be in the format “jetNEXUS.cap.gz” - Email this file to support@edgenexus.io
- You can view the contents using Wireshark
Adapter:
the drop-down, typically eth0
or eth1.
You can also capture all interfaces with “any“
Packets:
of packets to capture. Typically 99999
Duration:
the capture
will run for. A typical time is 15 seconds for high traffic sites. The
GUI will be inaccessible during the capture period
To maintain performance we have limited the download file to 10MB. If
you
find that this is not enough to capture all the data you require we can
increase this figure.
This will have an impact on performance of live sites. To increase the
available capture size please apply a global setting jetPACK to
increase the capture size.
 Back to